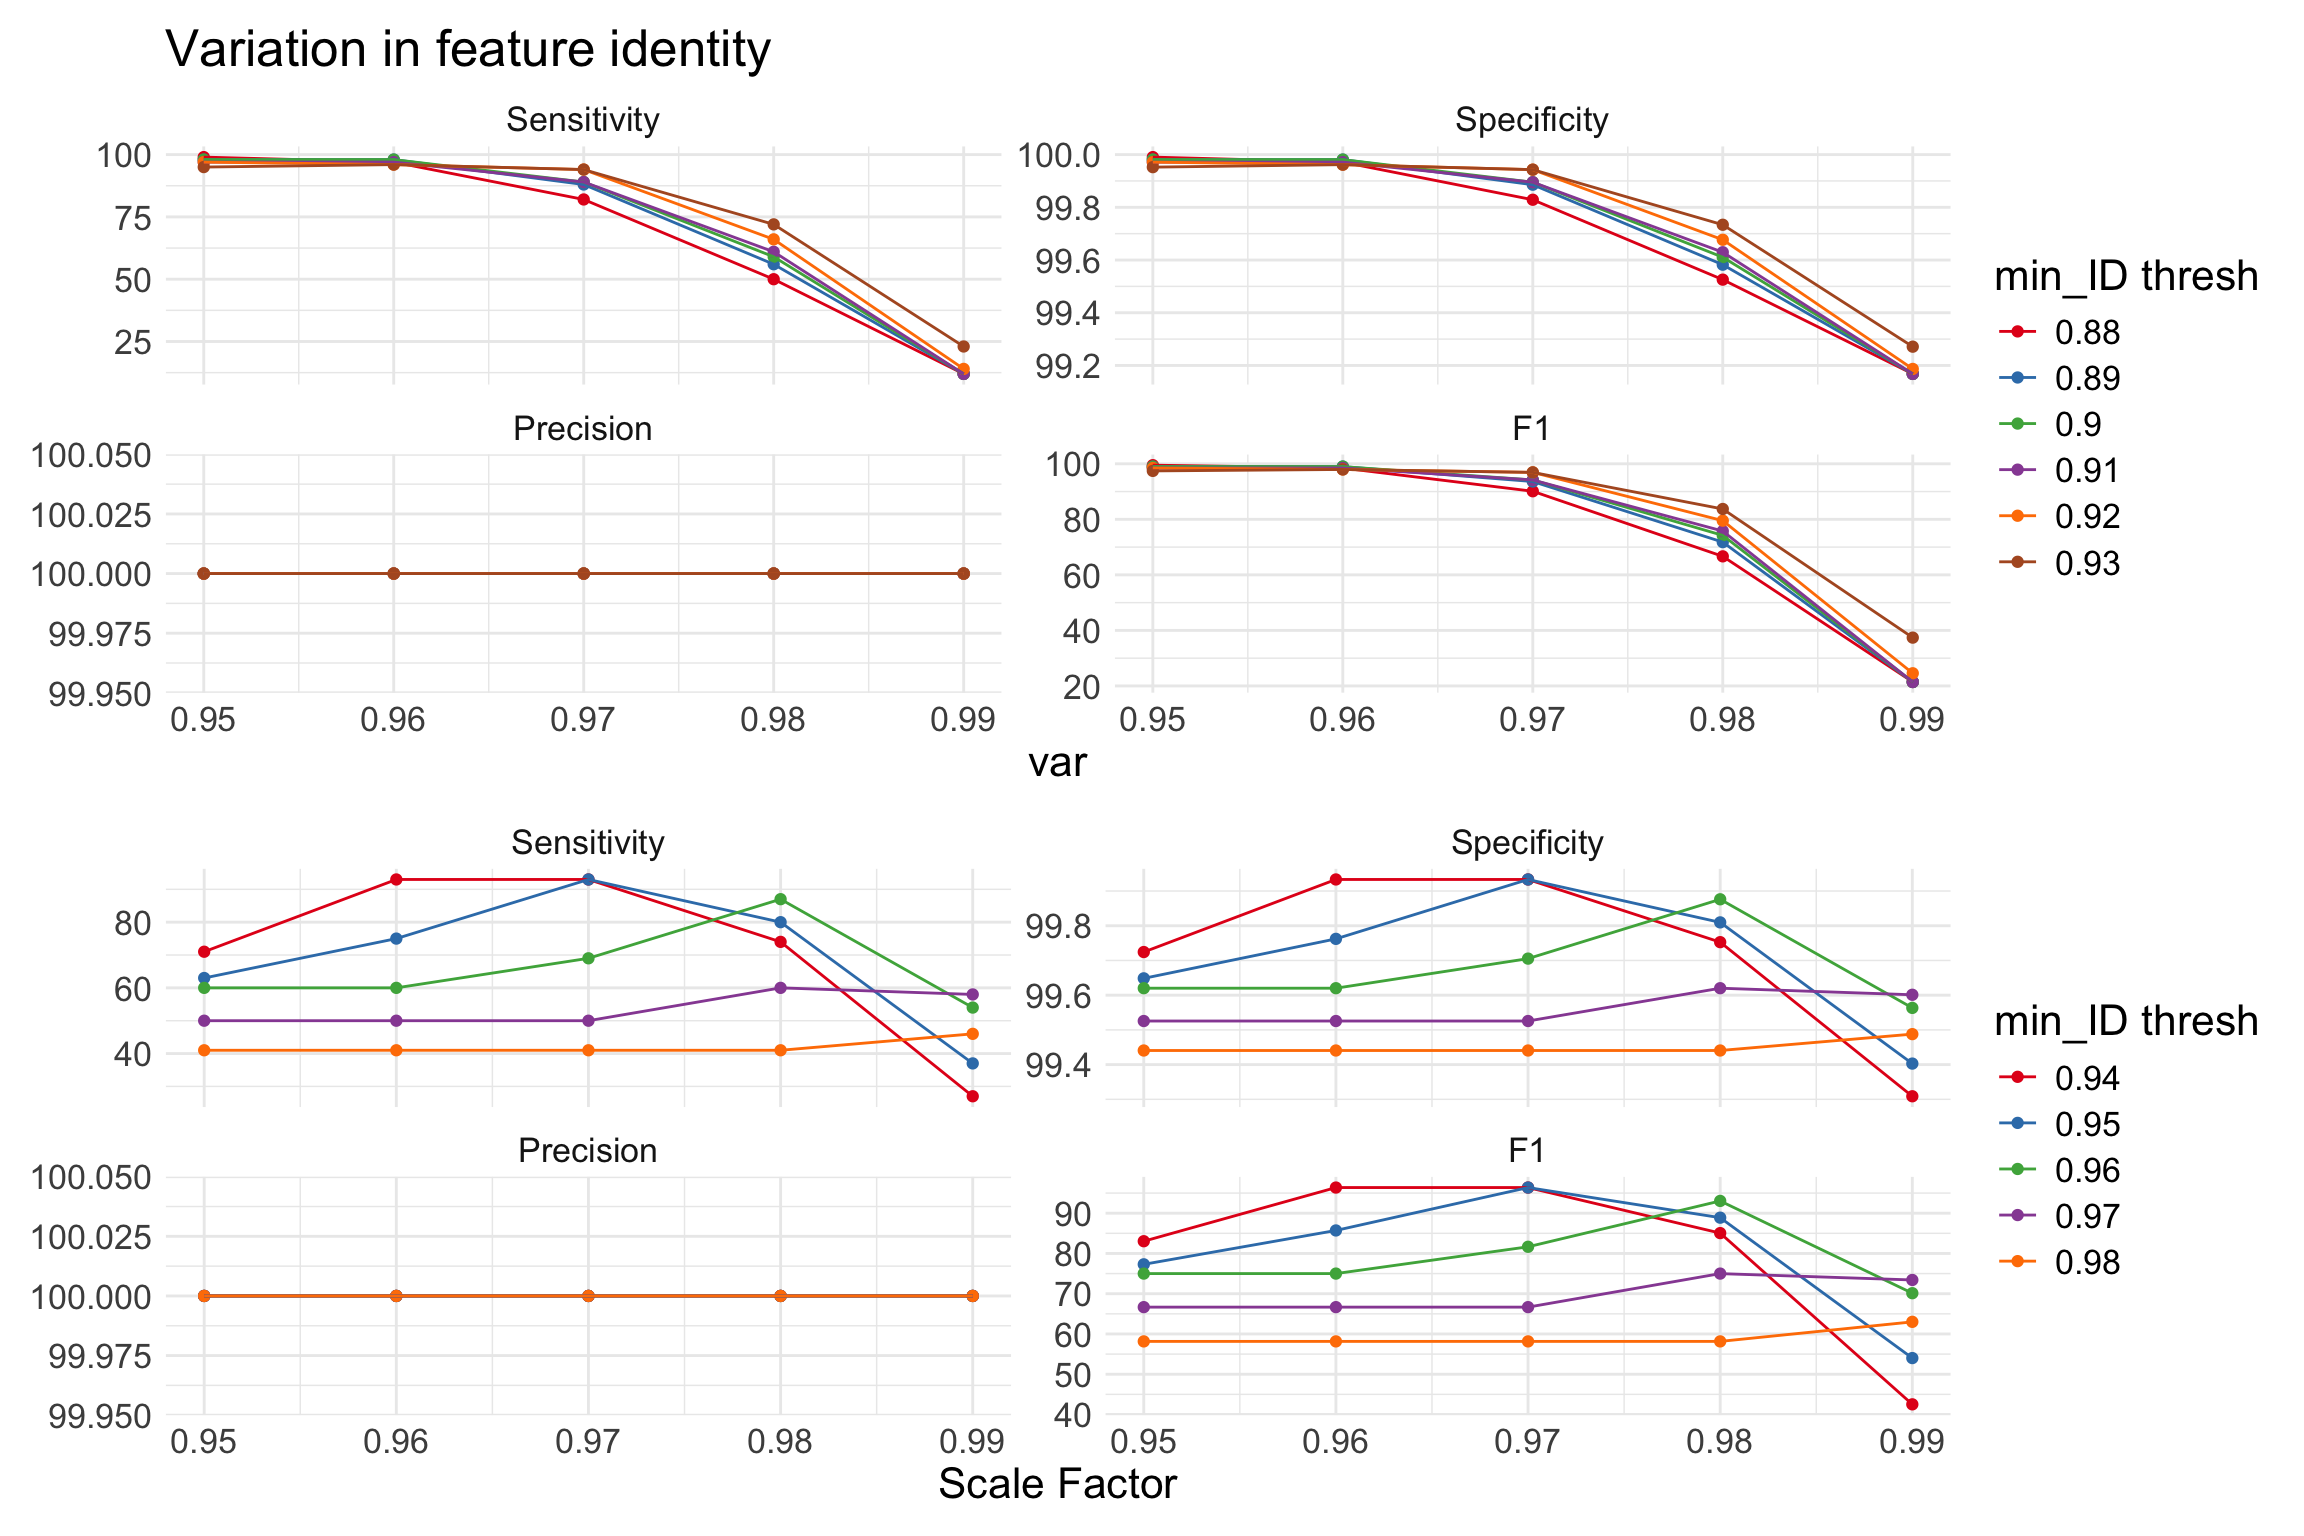
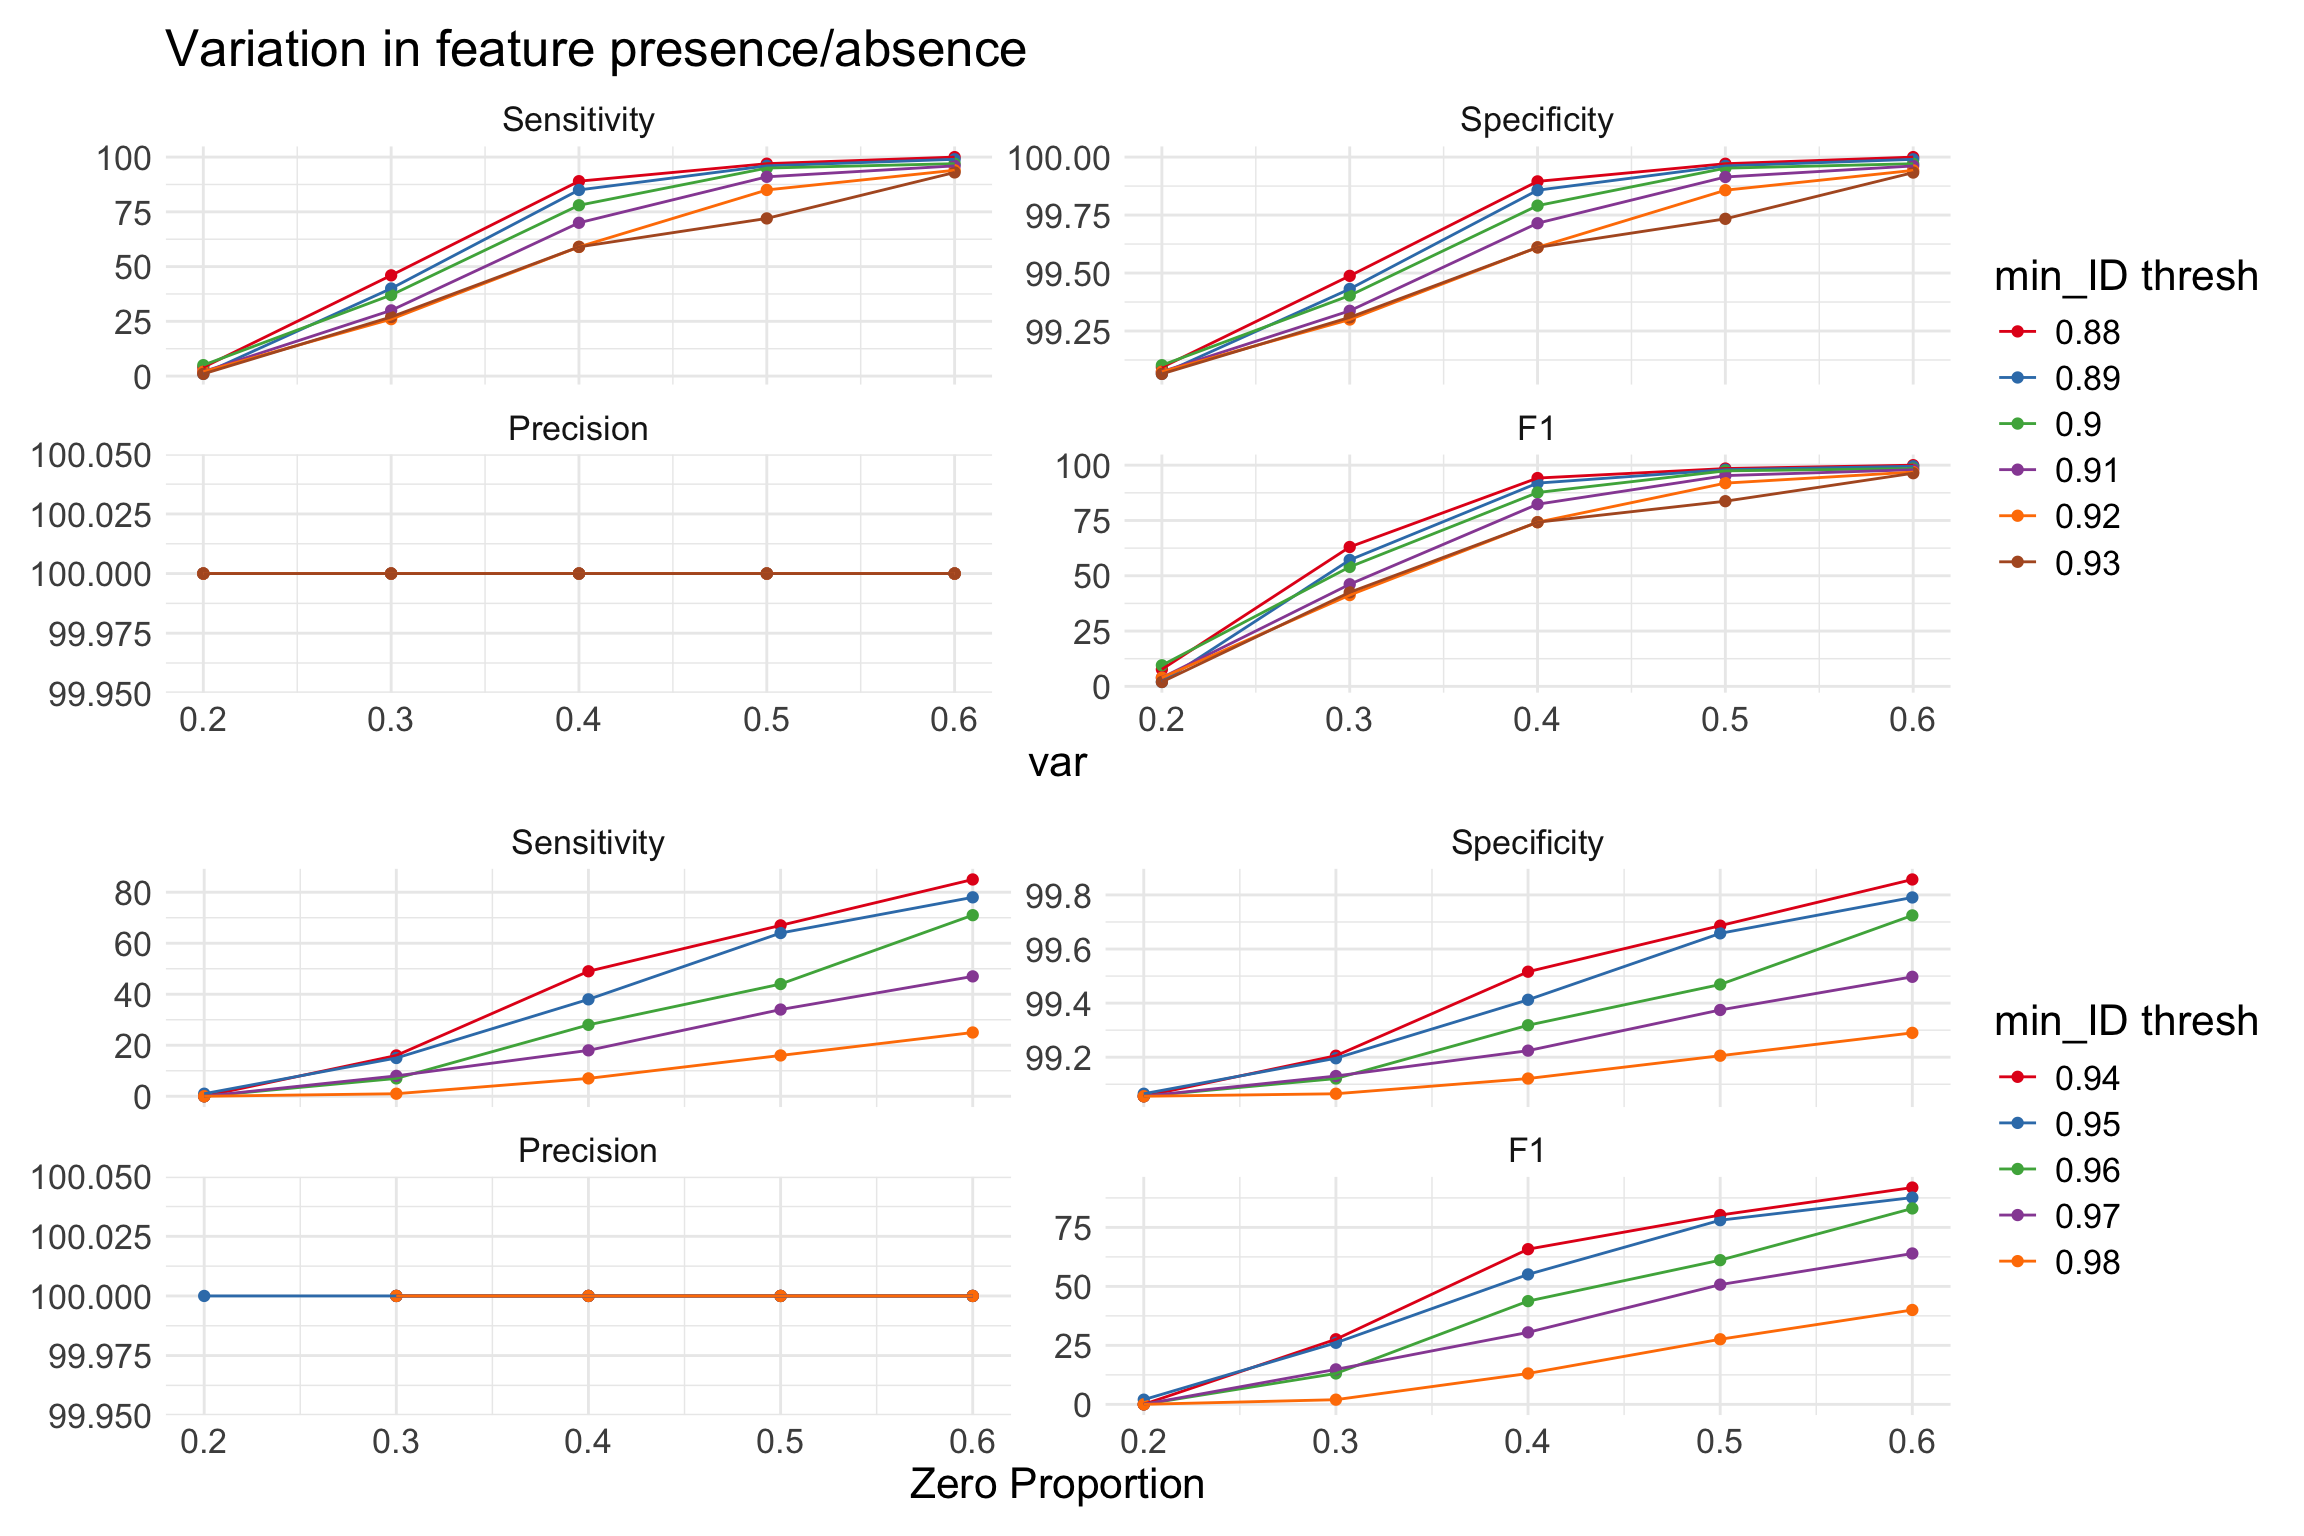
Logistic Regression (caseControlFit()) is susceptible to choice of identity threshold (min_identity). ### Load data and prepare for simulations
Sensitivity Analysis
Show code
# randomly select 100 features (contigs) to rescale abundance - ensure omit NA from cascon model
fit_cascon_null = readRDS("TEST_DATA/zeevi/TEMP_FITS/null_cascon.rds")
set.seed(789)
sel = sample(which(!is.na(fit_cascon_null@coefficients$X.Intercept.)), 100)
contigs = data@elementMetadata$Contig_name[sel]
Functions to generate plots and heatmaps
Show code
gg_facet_plot <- function(op, title = NULL){
  if('sf' %in% colnames(op)){
    op$var = as.numeric(op$sf)
    xlab_ = "Scale Factor"
  } else if('z_prop' %in% colnames(op)){
    op$var = as.numeric(op$z_prop)
    xlab_ = "Zero Proportion"
  }


  op$Test <- factor(op$Test)
  op$mID <- as.numeric(op$mID)
  op$tp = as.numeric(op$tp)
  op$fn = as.numeric(op$fn)
  op$fp = as.numeric(op$fp)
  op$tn = as.numeric(op$tn)

  op <- op %>% mutate(
    Sensitivity = tp / (tp + fn) * 100,
    Specificity = tn / (tn + fn) * 100,
    Precision   = tp / (tp + fp) * 100,
    F1          = 2 * tp / (2 * tp + fp + fn) * 100,
  )

  long_op <- op %>%
    pivot_longer(
      cols = c(Sensitivity, Specificity, Precision, F1),
      names_to = "Metric",
      values_to = "Value"
    )

  long_op <- long_op %>%
    mutate(mID_group = case_when(
      mID >= 0.88 & mID <= 0.93 ~ "0.88–0.93",
      mID > 0.93                ~ ">0.93"
    ))
  op$mID <- as.factor(op$mID)

  long_op$mID_group <- factor(long_op$mID_group, levels = c("0.88–0.93",">0.93"))
  long_op$Metric <- factor(long_op$Metric, levels = c("Sensitivity", "Specificity", "Precision","F1"))


  p1 = ggplot(filter(long_op, mID_group == "0.88–0.93"), aes(x = var, y = Value, color = factor(mID))) +
    geom_point() +
    geom_line() +
    facet_wrap(~ Metric, scales = "free_y") +
    labs(title = "mID: 0.88–0.93", color = "mID") +
    theme_minimal() +
    theme(text = element_text(size = 16)) +
    scale_color_manual(values = c("#E41A1C", "#377EB8", "#4DAF4A", "#984EA3", "#FF7F00", "#b15928"), name = "min_ID thresh")+
    labs(
      title = title,
      y = NULL
    )

  p2 = ggplot(filter(long_op, mID_group == ">0.93"), aes(x = var, y = Value, color = factor(mID))) +
    geom_point() +
    geom_line() +
    facet_wrap(~ Metric, scales = "free_y") +
    labs(title = "mID: 0.88–0.93", color = "mID") +
    theme_minimal() +
    theme(text = element_text(size = 16)) +
    scale_color_manual(values = c("#E41A1C", "#377EB8", "#4DAF4A", "#984EA3", "#FF7F00", "#FFFF33"), name = "min_ID thresh")+
    labs(
      title = NULL,
      x = xlab_,
      y = NULL
    )


  print(p1/p2)

}
Simulate changes in identity
Show code
save_path = "output_rds/logi_sim_id.rds"
if(file.exists(save_path)){
  op_id = readRDS(save_path)
} else {
  # run through by varying beta
  scale_factors = c(95:99/100)
  min_ids = c(88:98/100)

  op_id = data.frame()
  for(scale_factor in scale_factors){
    for(minID in min_ids){
      exp_beta = c()
      exp_zi = c()
      se = data # NULL

      data_matrix <- SummarizedExperiment::assay(se) # NULL
      vals_to_mod = data_matrix[sel, cases]

      for(i in 1:length(sel)){
        tmp = rescale_beta(x = data_matrix[sel[i], cases]/100,
                           beta = scale_factor,
                           zi = 0)

        vals_to_mod[i,] = tmp$rescaled*100
        exp_beta[i] = tmp$expected_beta
        exp_zi[i] = tmp$expected_zi
      }

      # add modified counts for cases
      data_matrix[sel, cases] = vals_to_mod

      # add modified assay back to se
      SummarizedExperiment::assay(se) <- data_matrix
      fit_cascon_updated = strainspy:::update_fit(fit = fit_cascon_null, se = se, update_idx = sel, nthreads = 10, min_identity = minID)
      cat("sf:", scale_factor,"--- mID:", minID, "\n")

      op_id = rbind(op_id,
                    cbind(scale_factor, minID,
                          rbind(c("cc", strainspy:::get_confusion_mx(top_hits = top_hits(fit_cascon_updated), gt_contigs = contigs, all_contigs = rownames(se), print_cm = T)))))
    }
  }

  colnames(op_id) = c("sf", "mID", "Test", "tp", "fn", "fp", "tn")
  saveRDS(op_id, save_path)

}

gg_facet_plot(op_id, "Variation in feature identity")
Simulate changes in presence/absence
Show code
save_path = "output_rds/logi_sim_pa.rds"
if(file.exists(save_path)){
  op_pa = readRDS(save_path)
} else {
  zero_props = 2:6/10
  min_ids = c(88:98/100)

  op_pa = data.frame()
  for(zero_prop in zero_props){
    for(minID in min_ids){
      exp_beta = c()
      exp_zi = c()
      se = data # NULL

      data_matrix <- SummarizedExperiment::assay(se) # NULL
      vals_to_mod = data_matrix[sel, cases]

      for(i in 1:length(sel)){
        tmp = rescale_beta(x = data_matrix[sel[i], cases]/100,
                           beta = 1,
                           zi = zero_prop)

        vals_to_mod[i,] = tmp$rescaled*100
        exp_beta[i] = tmp$expected_beta
        exp_zi[i] = tmp$expected_zi
      }

      # add modified counts for cases
      data_matrix[sel, cases] = vals_to_mod

      # add modified assay back to se
      SummarizedExperiment::assay(se) <- data_matrix
            fit_cascon_updated = strainspy:::update_fit(fit = fit_cascon_null, se = se, update_idx = sel, nthreads = 10, min_identity = minID)
      cat("zp:", zero_prop,"--- mID:", minID, "\n")

      op_pa = rbind(op_pa,
                    cbind(zero_prop, minID,
                          rbind(c("cc", strainspy:::get_confusion_mx(top_hits = top_hits(fit_cascon_updated), gt_contigs = contigs, all_contigs = rownames(se), print_cm = T)))))
    }
  }


  colnames(op_pa) = c("z_prop", "mID", "Test", "tp", "fn", "fp", "tn")
  saveRDS(op_pa, save_path)
}

gg_facet_plot(op_pa, "Variation in feature presence/absence")
Warning: Removed 4 rows containing missing values or values outside the scale range
(`geom_point()`).
Warning: Removed 4 rows containing missing values or values outside the scale range
(`geom_line()`).