Associations between gut microbial strains and cancer immunotherapy outcomes - a study in rare cancers and melanoma

Published

June 20, 2026

Load dependencies

Association testing

Classic StrainSpy applied to rare cancer and melanoma data in different combinations

Load the metadata for rare cancers

Show code
# Gunjur et al. data
meta_path_ash <- "./data/ash_pancancer/metadata_full.tsv"
meta_ash <- read.csv(meta_path_ash, sep = '\t') 
meta_ash = cbind(run_acc = meta_ash$run_accession, meta_ash)

# Outcome
meta_ash$RvsP = "R"
meta_ash$RvsP[which(meta_ash$BOR == "PD" | meta_ash$BOR == "cPD")] = "NR" 
meta_ash$RvsP = factor(meta_ash$RvsP, levels = c("NR", "R"))

Load Sylph outputs

Show code
sy_ash <- read_sylph("./data/ash_pancancer/combined_q_99.tsv.gz") # q99)
Detected Sylph query output file.
Show code
# annoying renames to match meta V sylph file
colnames(sy_ash) <- gsub("_1", "", colnames(sy_ash))
colData(sy_ash)$Sample_file <- gsub("_1", "", basename(colData(sy_ash)$Sample_file))

# Reorder meta_ash 
meta_ash = meta_ash[match(colnames(sy_ash), meta_ash$run_accession), ]
# get rid of SD
rmidx = which(meta_ash$BOR == "SD")
if(length(rmidx) > 0){
  meta_ash = meta_ash[-rmidx, ]
  sy_ash = sy_ash[, -rmidx]
}

sy_ash <- filter_by_presence(sy_ash, min_nonzero = 8) # filter at 10%
Retained 19139 rows after filtering
Show code
dim(sy_ash)
[1] 19139    77
Show code
# Checks before merging metadata
all(colnames(sy_ash) %in% meta_ash$run_accession)
[1] TRUE
Show code
all(meta_ash$run_accession %in% colnames(sy_ash))
[1] TRUE
Show code
sy_ash = modify_metadata(sy_ash, meta_ash)

Run StrainSpy

Show code
design <- as.formula("~ RvsP + histology_cohort.x + age + sex + BMI") 

save_path <- "output_rds/ASH_zib_q_99_ebp.rds"

if(file.exists(save_path)){
  ZB_fit <- readRDS(save_path)
} else {
  # Run with weak prior for prediction
  ebp = compute_eb_priors(sy_ash, design, nthreads = 10L, low_cutoff = 0, 
                          high_cutoff = Inf, progress = FALSE)
  ZB_fit <- glmZiBFit(sy_ash, design, nthreads = parallel::detectCores(), MAP_prior = ebp)
  saveRDS(ZB_fit, save_path)
}

# These are strainspy predictors from Pancx data
th = top_hits = top_hits(ZB_fit, coef = 2, alpha = 0.05)
Found 167 tophits for RvsPR at alpha = 0.05 using holm 

Inspect StrainSpy hits species/genera

Show code
tax_99 = read_taxonomy("data/TAXONOMY/sylph_DB_taxonomy_99.tsv")

th_ph = comp_ani_diff_and_posthoc_test(sy_ash, ZB_fit, th, progress = FALSE)

# Interestingly, these are all beta hits (differences in strain identity)
table(th_ph$hit_component)

beta 
 167 
Show code
th_ph_full = strainspy:::add_tax2tophits(th_ph, tax_99, c("Genus", "Species"))

tbl_full = table(th_ph_full$Species)
sort(tbl_full[tbl_full>5], decreasing = T)

Phascolarctobacterium_A succinatutens_B                     CAG-302 sp934162325 
                                     20                                       9 
      Lachnoclostridium_B faecipullorum                 Ruminococcus_C callidus 
                                      9                                       6 
Show code
tbl_full = table(th_ph_full$Genus)
sort(tbl_full[tbl_full>5], decreasing = T)

Phascolarctobacterium_A           Streptococcus              Prevotella 
                     23                      20                      13 
                CAG-302     Lachnoclostridium_B          Ruminococcus_C 
                     12                       9                       7 
Show code
# Although there are interesting looking strains, we should remove poorly supported ones
th_ph_filt = th_ph_full[is.na(th_ph_full$Comment), ]

tbl = table(th_ph_filt$Species)
sort(tbl, decreasing = T)

Phascolarctobacterium_A succinatutens_B               Faecalitalea cylindroides 
                                     20                                       4 
Phascolarctobacterium_A succinatutens_A               Angelakisella sp900547385 
                                      3                                       2 
                  Scatosoma sp900552625                    UBA11524 sp000437595 
                                      2                                       2 
             Bacteroides zhangwenhongii                     CAG-170 sp002404795 
                                      1                                       1 
                Clostridium sp000435835                   Faecousia sp022770345 
                                      1                                       1 
                    Rothia mucilaginosa                      Rothia sp001808955 
                                      1                                       1 
             Ruminococcus_C sp000433635                  Vescimonas sp000435555 
                                      1                                       1 
Show code
tbl = table(th_ph_filt$Genus)
sort(tbl, decreasing = T)

Phascolarctobacterium_A            Faecalitalea           Angelakisella 
                     23                       4                       2 
                 Rothia               Scatosoma                UBA11524 
                      2                       2                       2 
            Bacteroides                 CAG-170             Clostridium 
                      1                       1                       1 
              Faecousia          Ruminococcus_C              Vescimonas 
                      1                       1                       1 

Inspect effect sizes

Show code
th_ph_ord = th_ph_filt[order(abs(th_ph_filt$ANI_Difference) , decreasing = T),]

summary_tbl <- th_ph_filt %>%
  filter(!is.na(Species)) %>%
  group_by(Species) %>%
  summarise(
    N_hits = n(),
    
    Top_adj_p_beta  = min(p_adjust, na.rm = TRUE),
    Top_coef_beta   = coefficient[which.min(p_adjust)],
    Top_se_beta     = std_error[which.min(p_adjust)],
    Top_contig_beta = Contig_name[which.min(p_adjust)],
    
    Top_adj_p_ZI    = min(zi_p_adjust, na.rm = TRUE),
    Top_coef_ZI     = zi_coefficient[which.min(zi_p_adjust)],
    Top_se_ZI       = zi_std_error[which.min(zi_p_adjust)],
    Top_contig_ZI   = Contig_name[which.min(zi_p_adjust)],
    
    
    .groups = "drop"
  ) %>%
  mutate(
    Min_adj_p = pmin(Top_adj_p_beta, Top_adj_p_ZI, na.rm = TRUE),
    Dominant_component = ifelse(Top_adj_p_beta < Top_adj_p_ZI, "Beta", "ZI"),
    Dominant_contig    = ifelse(Dominant_component == "Beta", Top_contig_beta, Top_contig_ZI),
    Dominant_coef      = ifelse(Dominant_component == "Beta", Top_coef_beta, Top_coef_ZI),
    Dominant_se        = ifelse(Dominant_component == "Beta", Top_se_beta, Top_se_ZI)
  ) %>%
  select(Species, N_hits, Dominant_component, Min_adj_p, Dominant_coef, Dominant_se, Dominant_contig) %>%
  arrange(Min_adj_p)

beta_summary <- summary_tbl %>%
  filter(Dominant_component == "Beta") %>%
  arrange(Min_adj_p) %>%
  mutate(
    CI_low = Dominant_coef - 1.96 * Dominant_se,
    CI_high = Dominant_coef + 1.96 * Dominant_se,
    Trend = ifelse(Dominant_coef > 0, "\u2191 R (similar)", "\u2193 R (divergent)"),
    Species = factor(Species, levels = rev(unique(Species)))
  ) %>%
  arrange(desc(Dominant_coef)) %>%
  mutate(Species = factor(Species, levels = rev(unique(Species))))

ggplot(beta_summary, aes(x = Dominant_coef, y = Species, color = Trend)) +
  geom_point(aes(size = N_hits)) +
  geom_errorbar(aes(xmin = CI_low, xmax = CI_high), width = 0.2) +
  geom_vline(xintercept = 0, linetype = "dashed") +
  scale_color_manual(values = c("\u2191 R (similar)" = "red",
                                "\u2193 R (divergent)" = "blue")) +
  scale_size_continuous(
    name = "Strains",
    range = c(2, 8),
    breaks = c(1, 5, 20),
    labels = c("1", "5", "20")
  ) +
  labs(
    x = "Effect size (difference in ANI, NR vs R)",
    y = "Species",
    color = "Trend"
  ) +
  theme_minimal(base_size = 16)
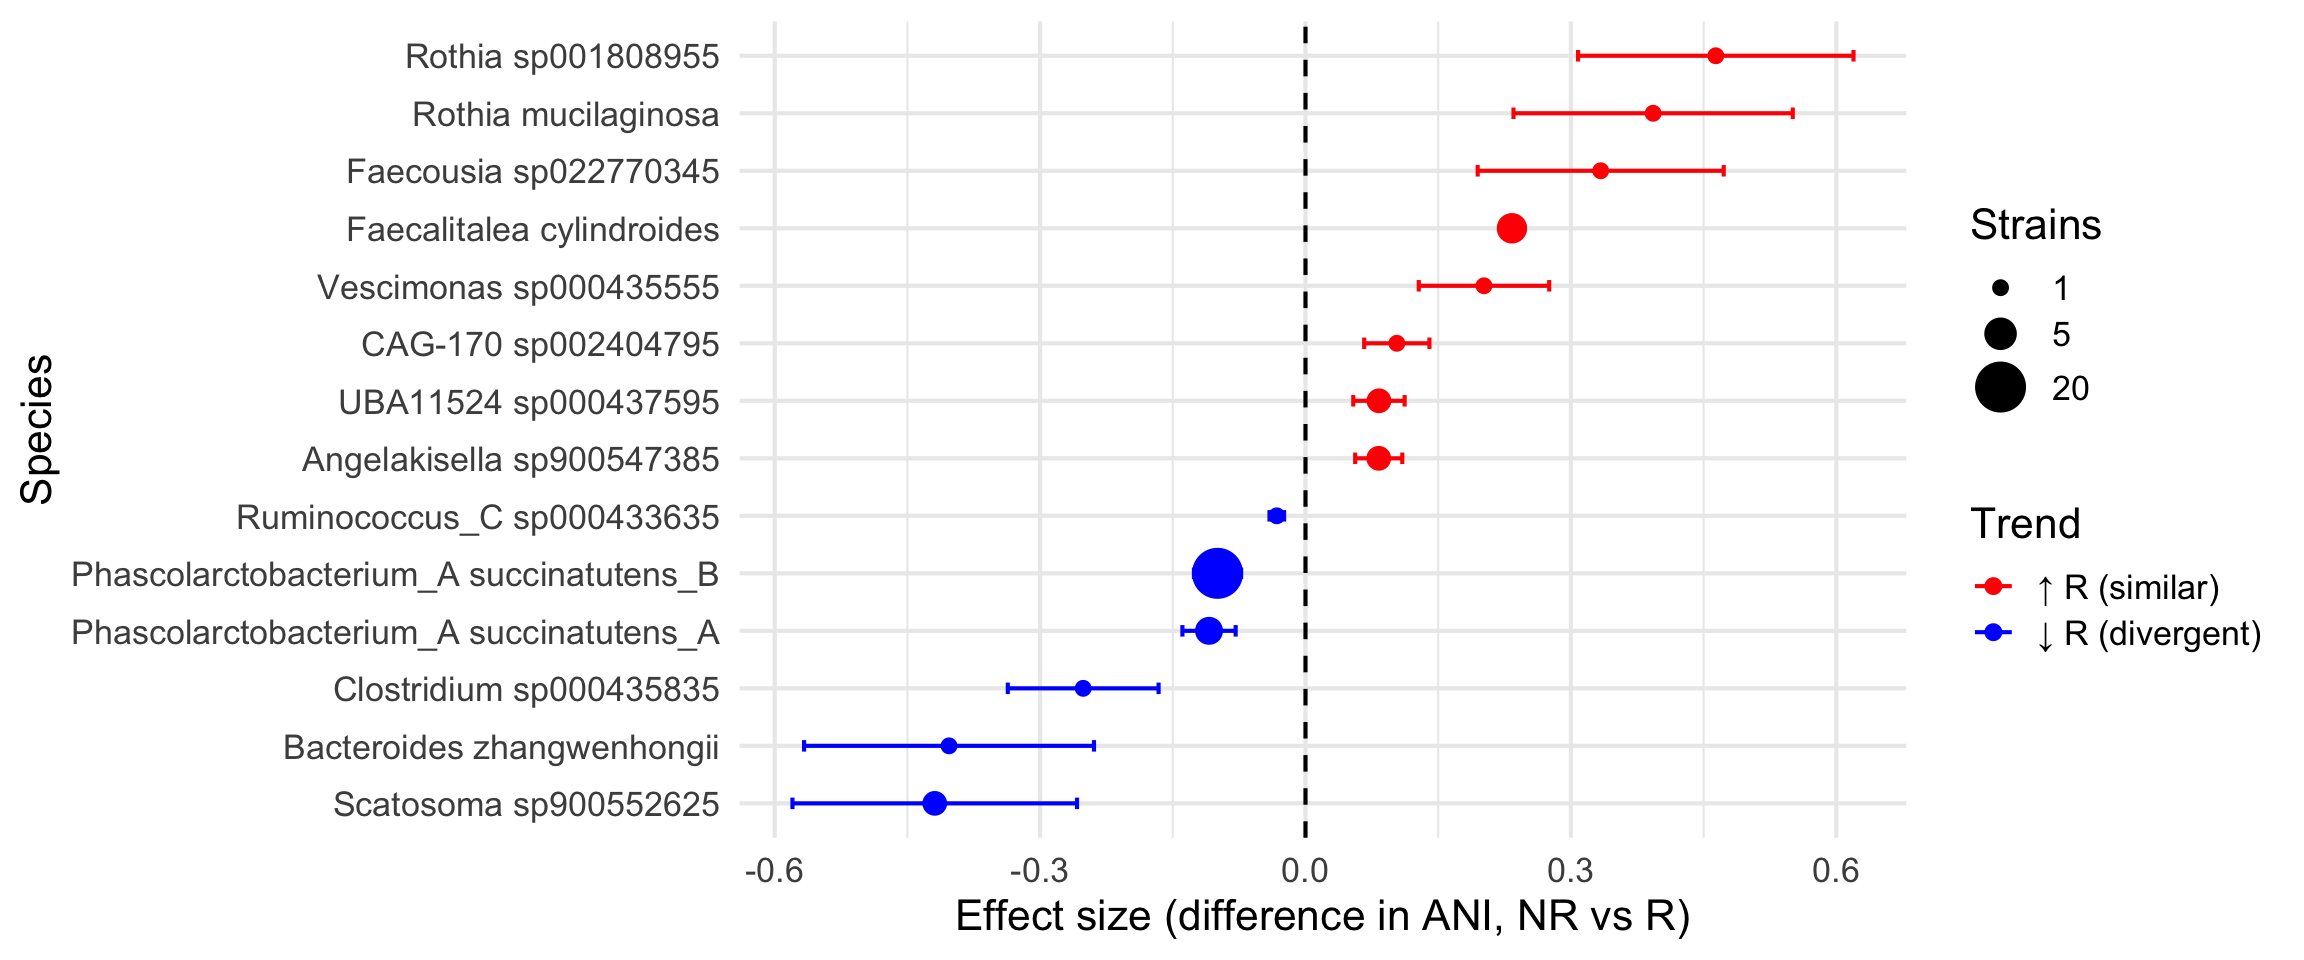
Show code
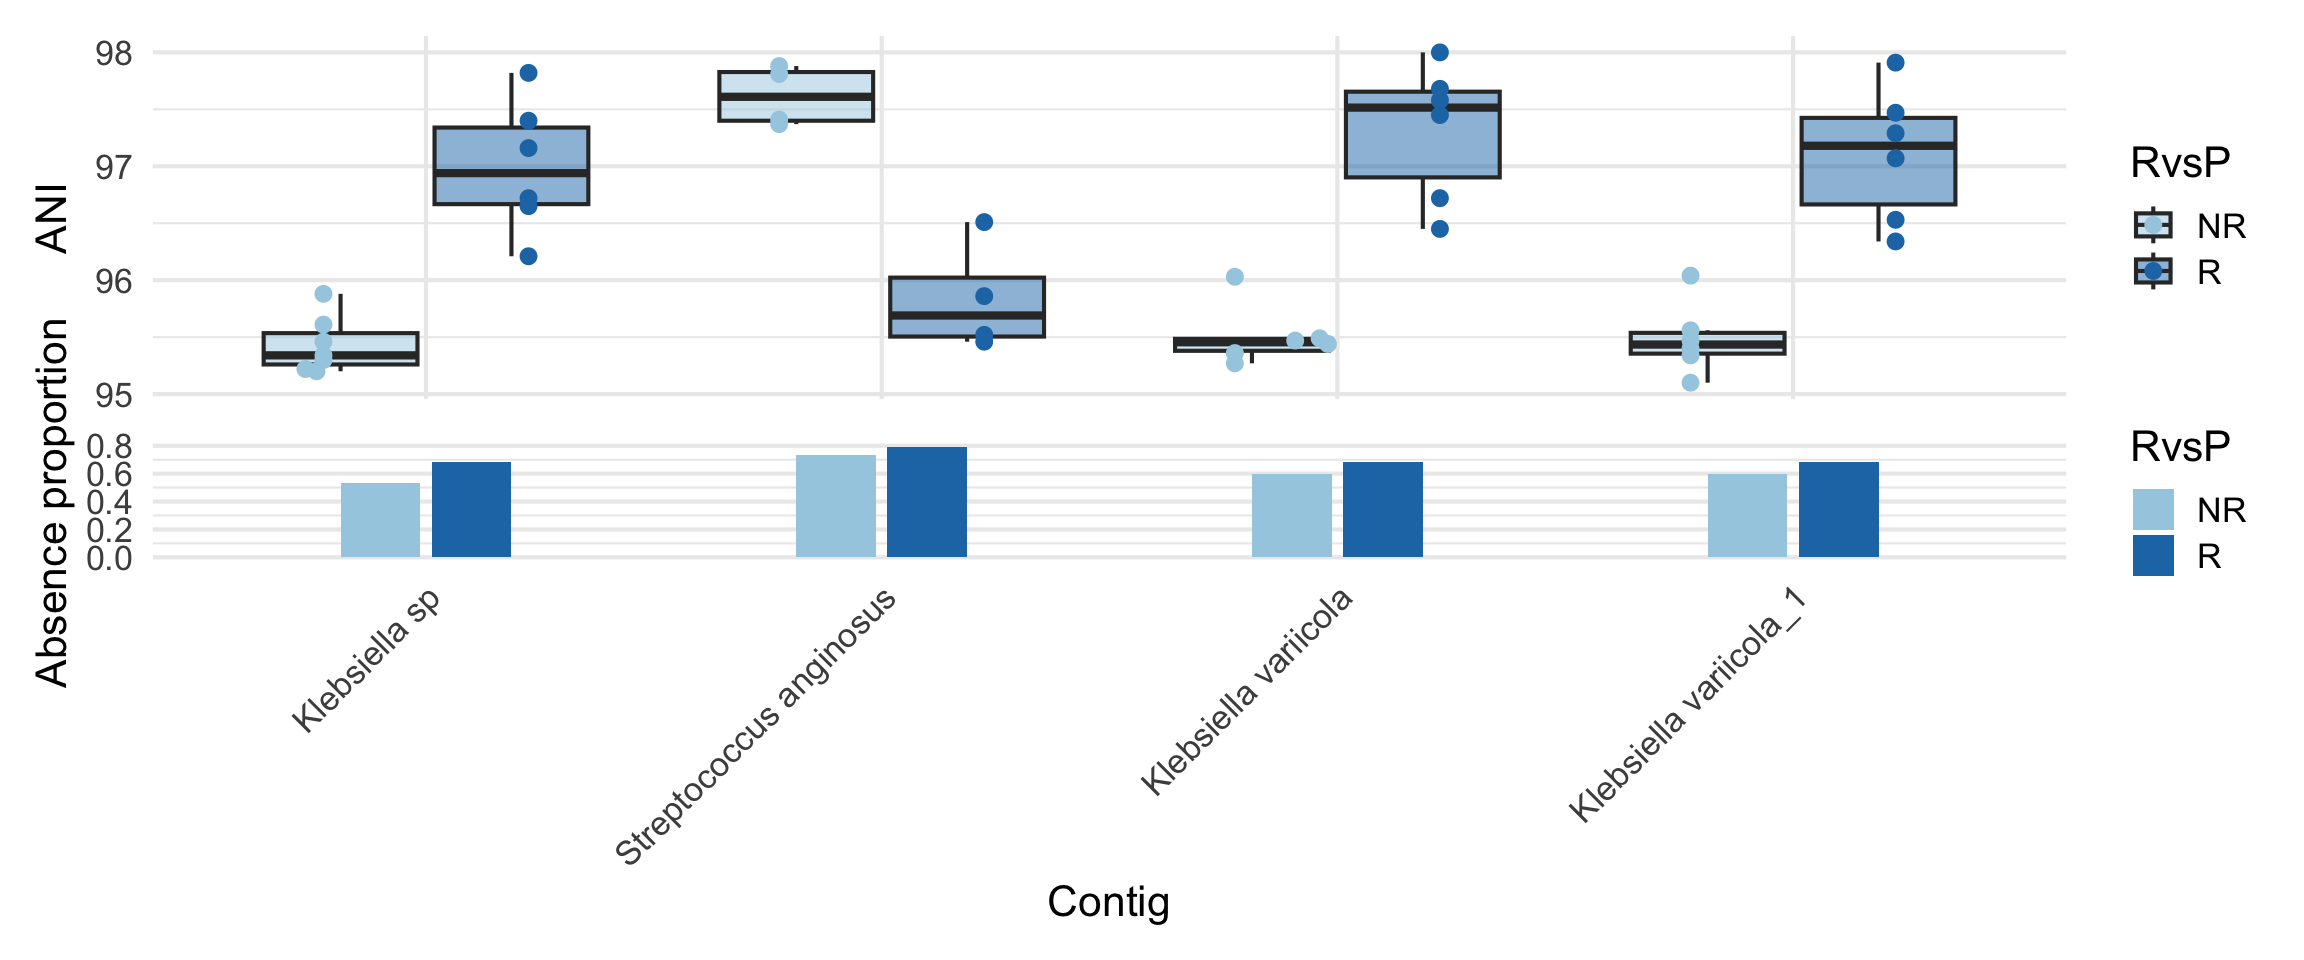
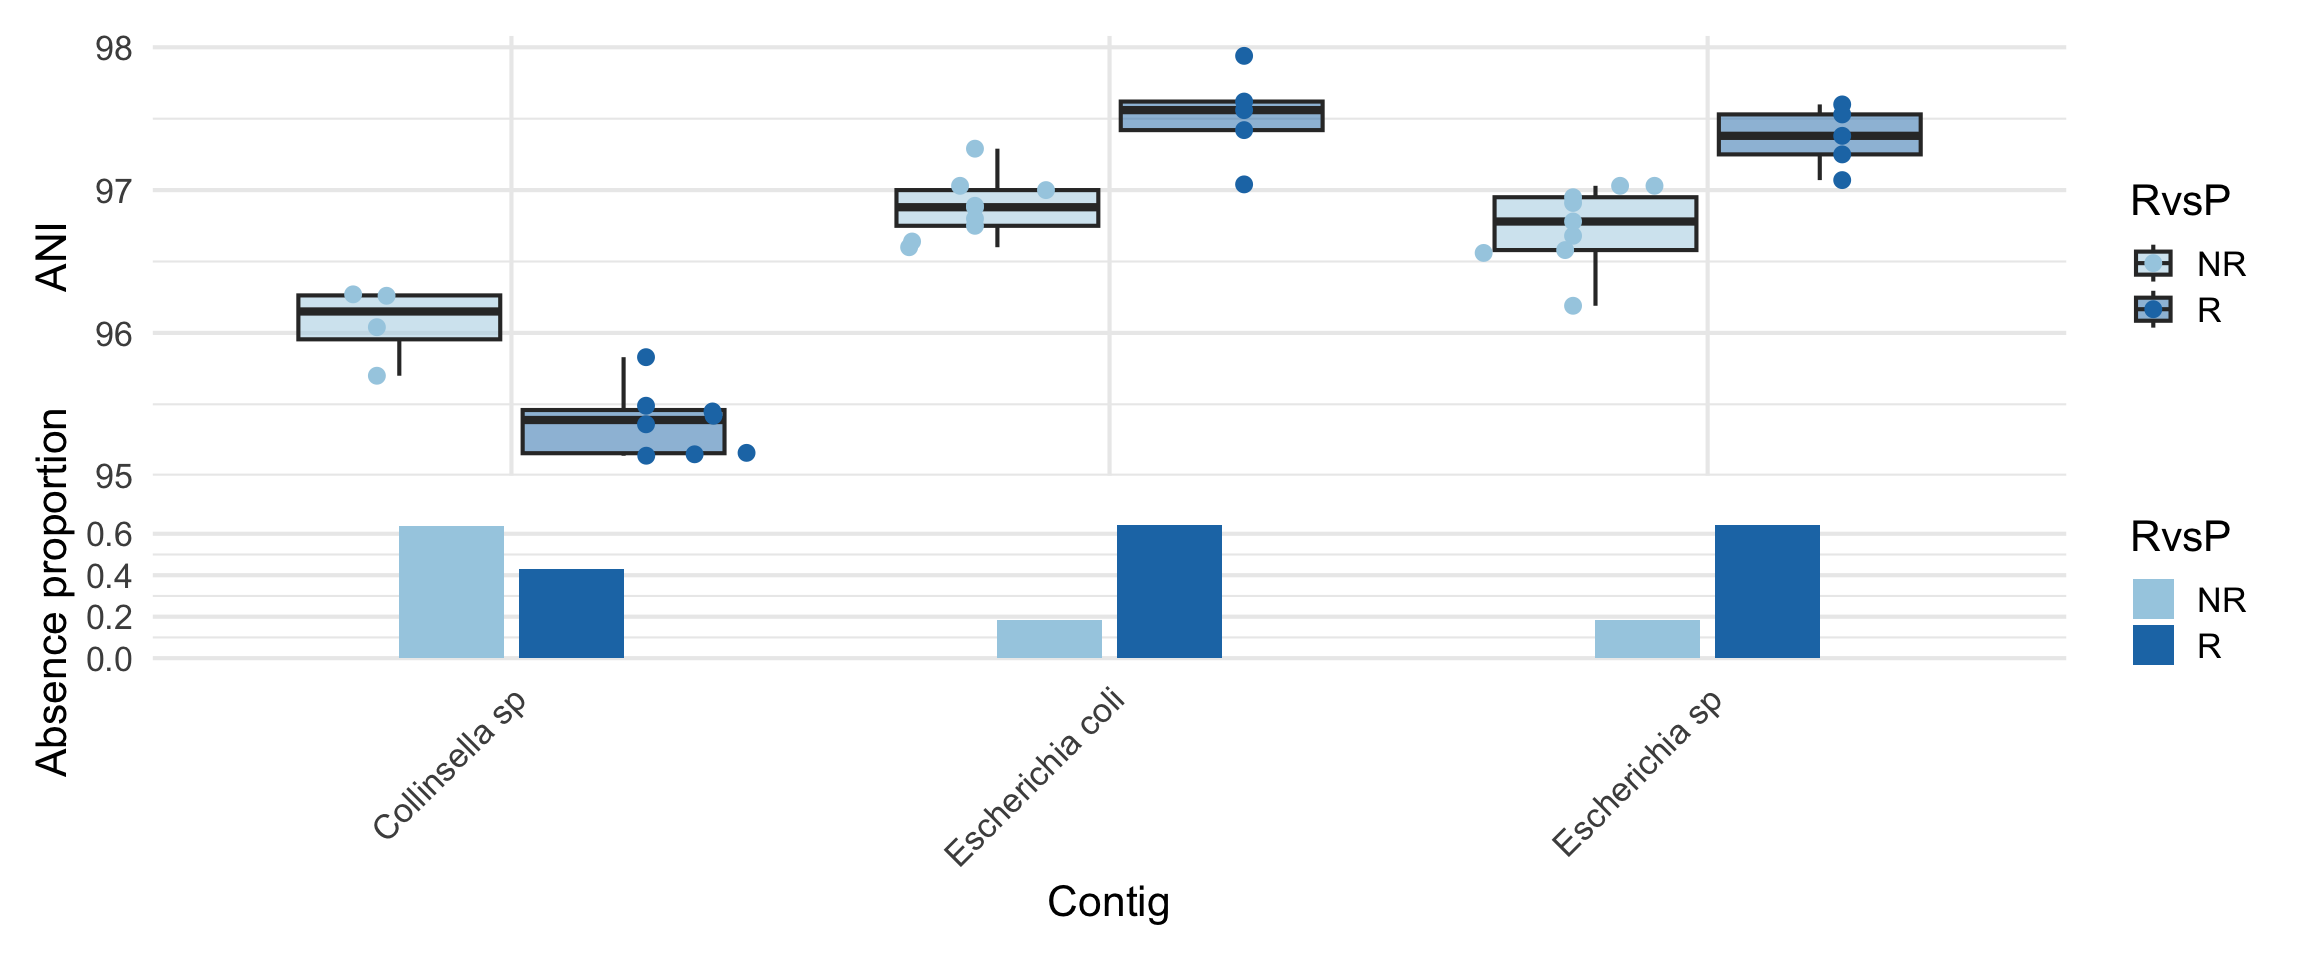
# Some of these hits appear interesting
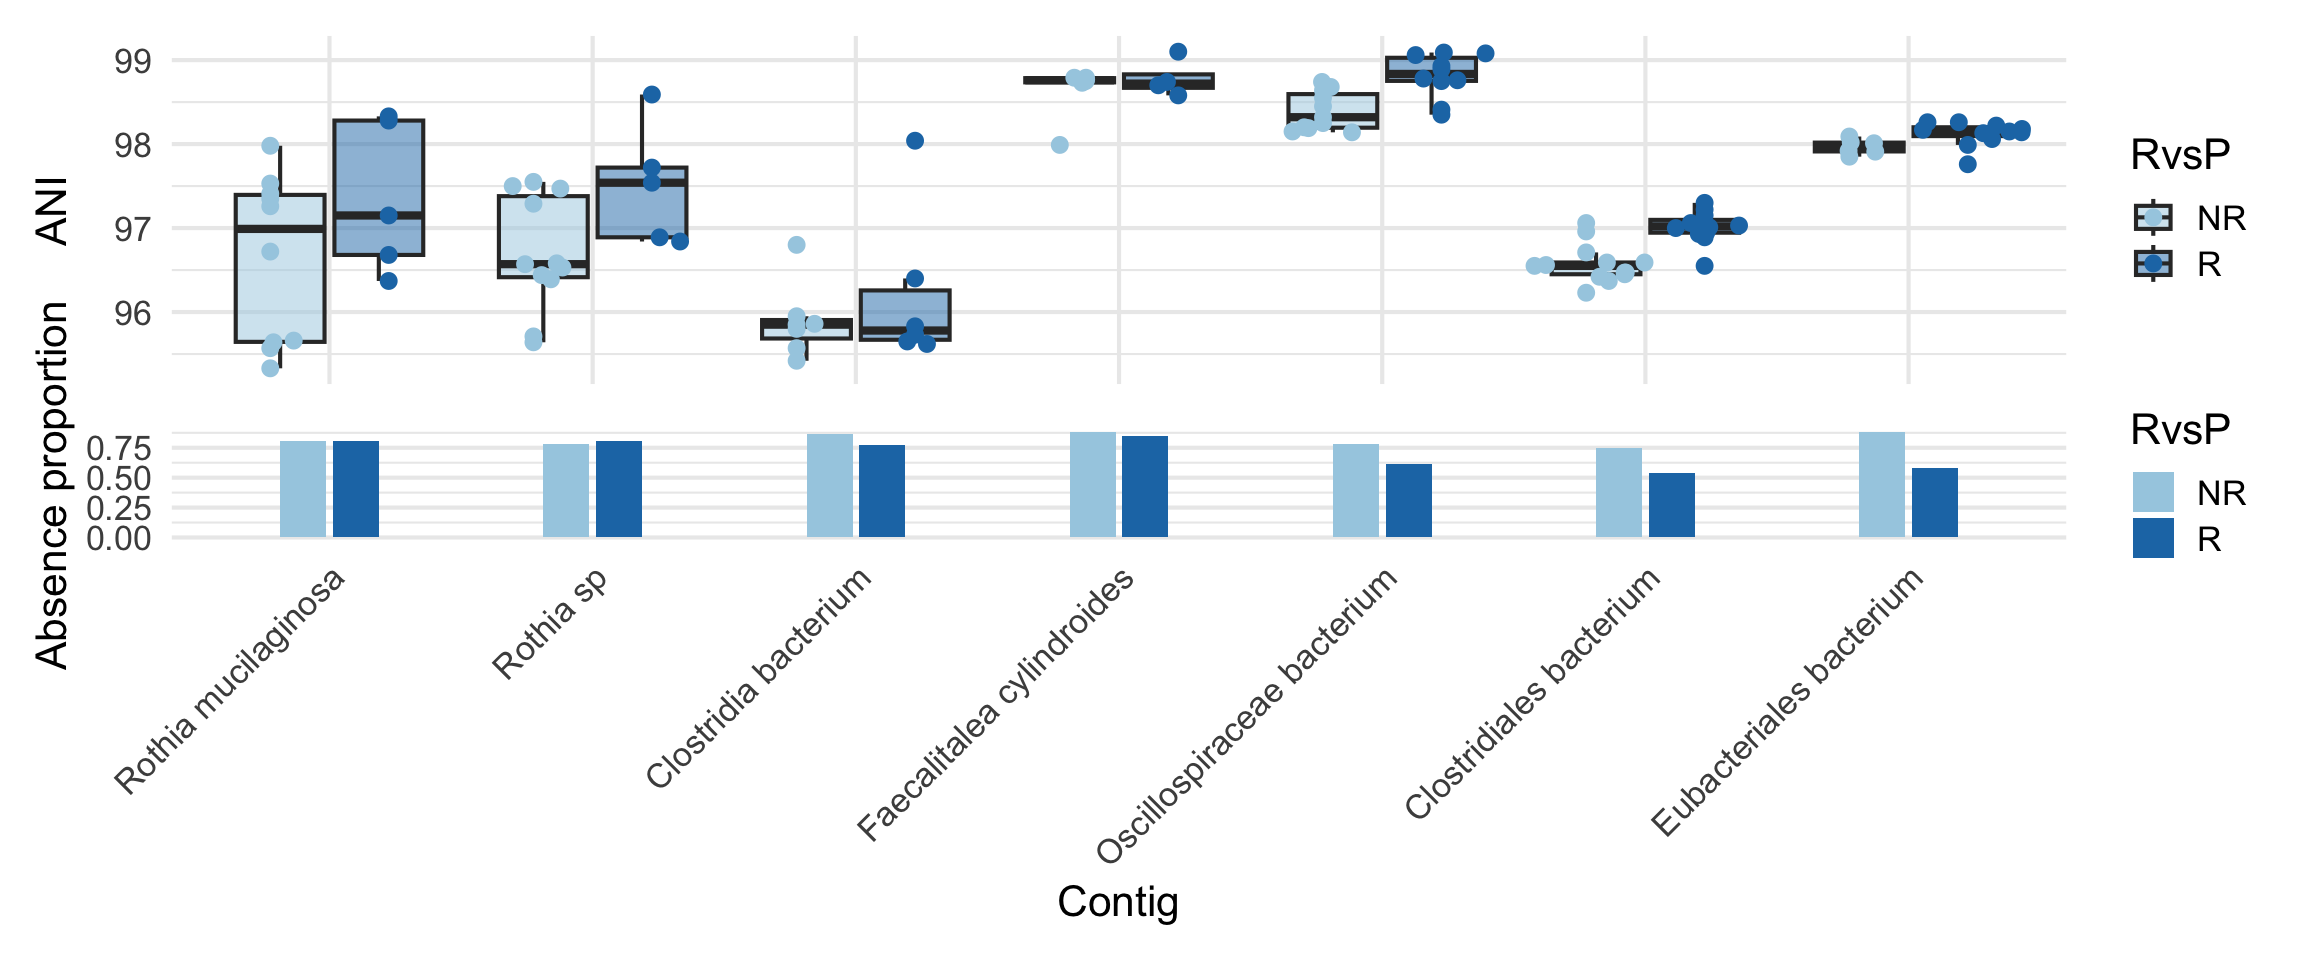
plot_ani_dist(sy_ash, 'RvsP', beta_summary$Dominant_contig[1:7])
Warning: Removed 422 rows containing non-finite outside the scale range
(`stat_boxplot()`).

Show code
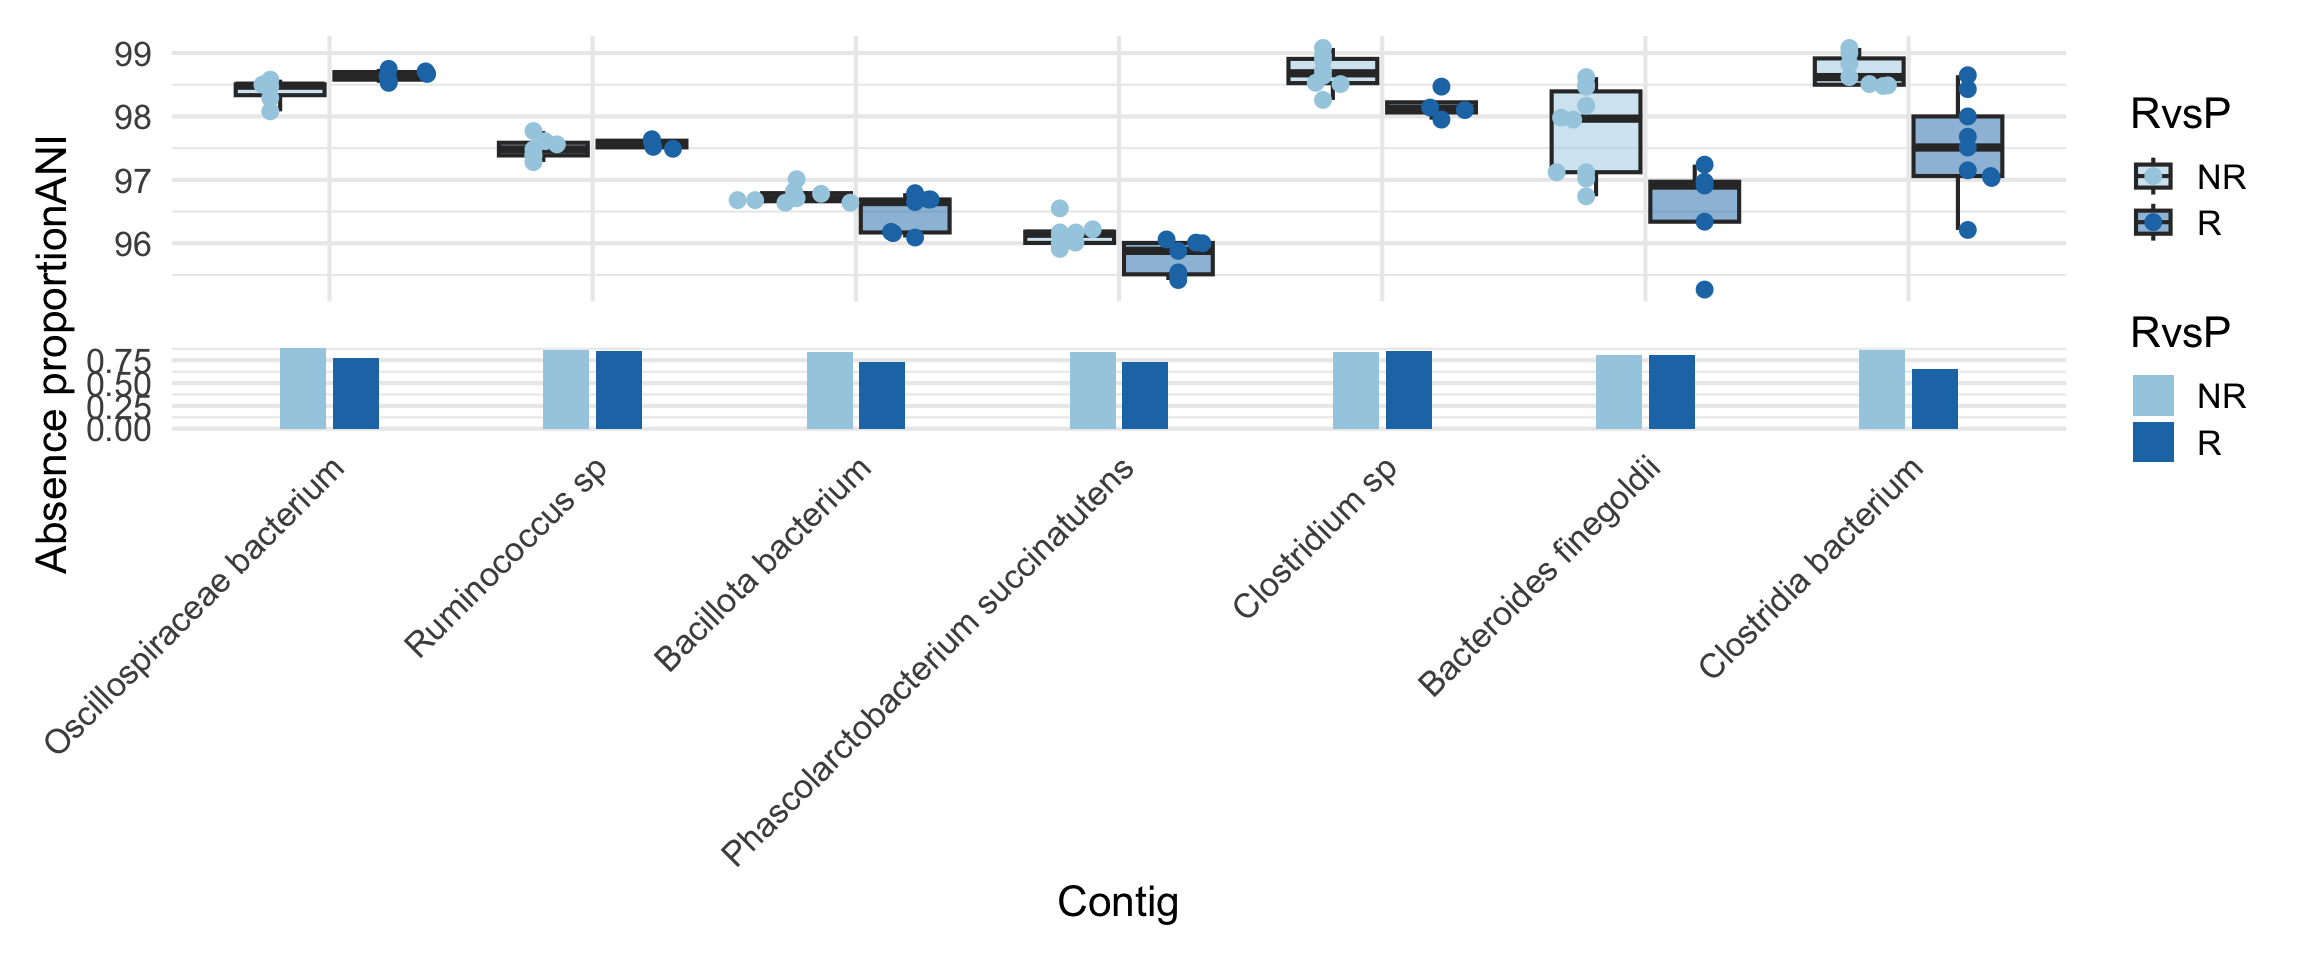
plot_ani_dist(sy_ash, 'RvsP', beta_summary$Dominant_contig[8:14])
Warning: Removed 443 rows containing non-finite outside the scale range
(`stat_boxplot()`).

Hits in Rothia sp, specifically Rothia mucilaginosa, previously detected modulating CRC immunotherapy response - reported previously is an abundance (presence/absence) signal, but we see a difference in strain identity - https://journals.plos.org/plosone/article?id=10.1371/journal.pone.0307639

Hits in Phascolarctobacterium and Ruminococcus have been previously detected modulating lung cancer immunotherapy response - https://link.springer.com/article/10.1186/s40164-023-00442-x

Bacteroides sp. - well studied and understood role in modulating CTLA-4 blockade - https://www.science.org/doi/10.1126/science.aad1329 - our hit is from a weird and less known species - but the genus is correct. ANI can theoretically tag links like this.

There are some other papers discussing Phascolarctobacterium and Clostridium hits, but they don’t look very specific and our hits are again from not well classified species (https://www.nature.com/articles/s41586-019-0878-z, https://www.nature.com/articles/s41591-022-01694-6, https://www.tandfonline.com/doi/full/10.1080/2162402X.2022.2081010)

Rare cancer + Melanoma - combined dataset

Show code
meta_path <- "./data/ash_pancancer/metadata_full.tsv"
meta_pan <- read.csv(meta_path, sep = '\t') 
meta_pan = cbind(run_acc = meta_pan$run_accession, meta_pan)
# From paper:
# RvsP = CR or PR VS. PD or cPD - excluded patients with a BOR of stable disease (SD) (n=29)

# Outcome
meta_pan$RvsP = "R"
meta_pan$RvsP[which(meta_pan$BOR == "PD" | meta_pan$BOR == "cPD")] = "NR" 
meta_pan$RvsP = factor(meta_pan$RvsP, levels = c("NR", "R"))

# Melanoma meta
meta_m = read.csv("data/melanoma_pooled/meta_melanoma_sm.csv")

meta = rbind(data.frame(X = meta_pan$run_acc, c_type = "RARE", type = meta_pan$histology_cohort.x, therapy_type = "combination", RvsP = meta_pan$RvsP), 
             data.frame(X = meta_m$X, c_type = "MEL", type = meta_m$Study_simplified, therapy_type = meta_m$ICB, RvsP = meta_m$ORR))
meta$therapy_type <- ifelse(meta$therapy_type %in% c("aPD1/aCTLA", "combination"), "CICB", ifelse(meta$therapy_type == "aPD1", "PD1", "other"))
meta$therapy_type[is.na(meta$therapy_type)] = "other" # Get this of the NAs 

sy <- read_sylph("./data/ash_pancancer/merged_pan_melanoma.tsv.gz") # q99)
Detected Sylph query output file.
Show code
# annoying renames to match meta V sylph file
colnames(sy) <- gsub("_1", "", colnames(sy))
colData(sy)$Sample_file <- gsub("_1", "", basename(colData(sy)$Sample_file))

# Reorder meta 
meta = meta[match(colnames(sy), meta$X), ]

sy <- filter_by_presence(sy, min_nonzero = 53) # filter at 10%
Retained 19691 rows after filtering
Show code
dim(sy)
[1] 19691   526
Show code
# Checks before merging metadata
all(colnames(sy) %in% meta$X)
[1] TRUE
Show code
all(meta$X %in% colnames(sy))
[1] TRUE
Show code
sy = modify_metadata(sy, meta, replace = T)

Other association tests

Show code
#### DO NOT RE-RUN BELOW - NO HITS ####


## Full dataset (526 samples) ### No hits for this ##
# design <- as.formula("~ RvsP") # no hits
# design <- as.formula("~ RvsP + c_type") # no hits
# design <- as.formula("~ RvsP + type") # no hits
# design <- as.formula("~ RvsP + type + therapy_type") # no hits
# 
# if(file.exists(save_path)){
#   ZB_fit <- readRDS(save_path)
# } else {
#   # Run with weak prior for prediction
#   ebp = compute_eb_priors(sy, design, nthreads = 10L, low_cutoff = 0, high_cutoff = Inf)
#   ZB_fit <- glmZiBFit(sy, design, nthreads = parallel::detectCores(), MAP_prior = ebp)
#   saveRDS(ZB_fit, save_path)
# }


# Drop Spencer and retry (359 samples)
# sy_nospecer = sy[,sy$type!="Spencer_2021"]
# sy_nospecer <- filter_by_presence(sy_nospecer, min_nonzero = 36) # filter at 10%
# 
# # Drop rare cancers + spencer and retry
# sy_nospecer_norare = sy_nospecer[,sy_nospecer$c_type!="RARE"]
# sy_nospecer_norare <- filter_by_presence(sy_nospecer_norare, min_nonzero = 25) # filter at 10%
# 
# design <- as.formula("~ RvsP + type + therapy_type") # still no hits
# 
# save_path <- "output_rds/ASH+mela_zib_q_99_ebp.rds"
# 
# if(file.exists(save_path)){
#   ZB_fit <- readRDS(save_path)
# } else {
#   # Run with weak prior for prediction
#   ebp = compute_eb_priors(sy_nospecer_norare, design, nthreads = 10L, low_cutoff = 0, high_cutoff = Inf)
#   ZB_fit <- glmZiBFit(sy_nospecer_norare, design, nthreads = parallel::detectCores(), MAP_prior = ebp)
#   saveRDS(ZB_fit, save_path)
# }

# Try individual melanoma datasets as well - There are some hits here
op_th_melanoma_ind = data.frame()
sets = c("Frankel_2017","Gopalakrishnan_2018","Lee_2022","Matson_2018","McCulloch_2022","Spencer_2021")
design <- as.formula("~ RvsP") 
for (set in sets){
  sy1 = sy[,which(sy$type == set)]
  dim(sy1)
  sy1 = filter_by_presence(sy1, ceiling(dim(sy1)[2]/10))
  
  save_path <- file.path("output_rds", paste("melanoma_", set, ".rds", sep = ""))
  # design <- as.formula("~ RvsP") # no hits
  if(file.exists(save_path)){
    ZB_fit <- readRDS(save_path)
  } else {
    # Run with weak prior for prediction
    ebp = compute_eb_priors(sy1, design, nthreads = 10L, low_cutoff = 0, high_cutoff = Inf)
    ZB_fit <- glmZiBFit(sy1, design, nthreads = parallel::detectCores(), MAP_prior = ebp)
    saveRDS(ZB_fit, save_path)
  }
  th_out = top_hits(ZB_fit)
  if(nrow(th_out) > 0)
  {
    th_out = comp_ani_diff_and_posthoc_test(sy1, ZB_fit, th_out, progress = FALSE) # drop poorly supported ones on the fly
    op_th_melanoma_ind = rbind(op_th_melanoma_ind, 
                               cbind(th_out, dset = set)
    )
  }
}
Retained 18865 rows after filtering
Found 37 tophits for RvsPR at alpha = 0.05 using holm 
Retained 15631 rows after filtering
Found 305 tophits for RvsPR at alpha = 0.05 using holm 
Retained 19319 rows after filtering
Warning in top_hits(ZB_fit): Multiple testing correction using `holm`: No
significant associations detected for coef = 2 at alpha = 0.050000
Retained 17963 rows after filtering
Found 44 tophits for RvsPR at alpha = 0.05 using holm 
Retained 18582 rows after filtering
Found 3 tophits for RvsPR at alpha = 0.05 using holm 
Retained 16037 rows after filtering
Warning in top_hits(ZB_fit): Multiple testing correction using `holm`: No
significant associations detected for coef = 2 at alpha = 0.050000
Show code
op_th_melanoma_ind = op_th_melanoma_ind[is.na(op_th_melanoma_ind$Comment), ]
op_th_melanoma_ind = strainspy:::add_tax2tophits(op_th_melanoma_ind, taxonomy = tax_99, c("Genus", "Species"))

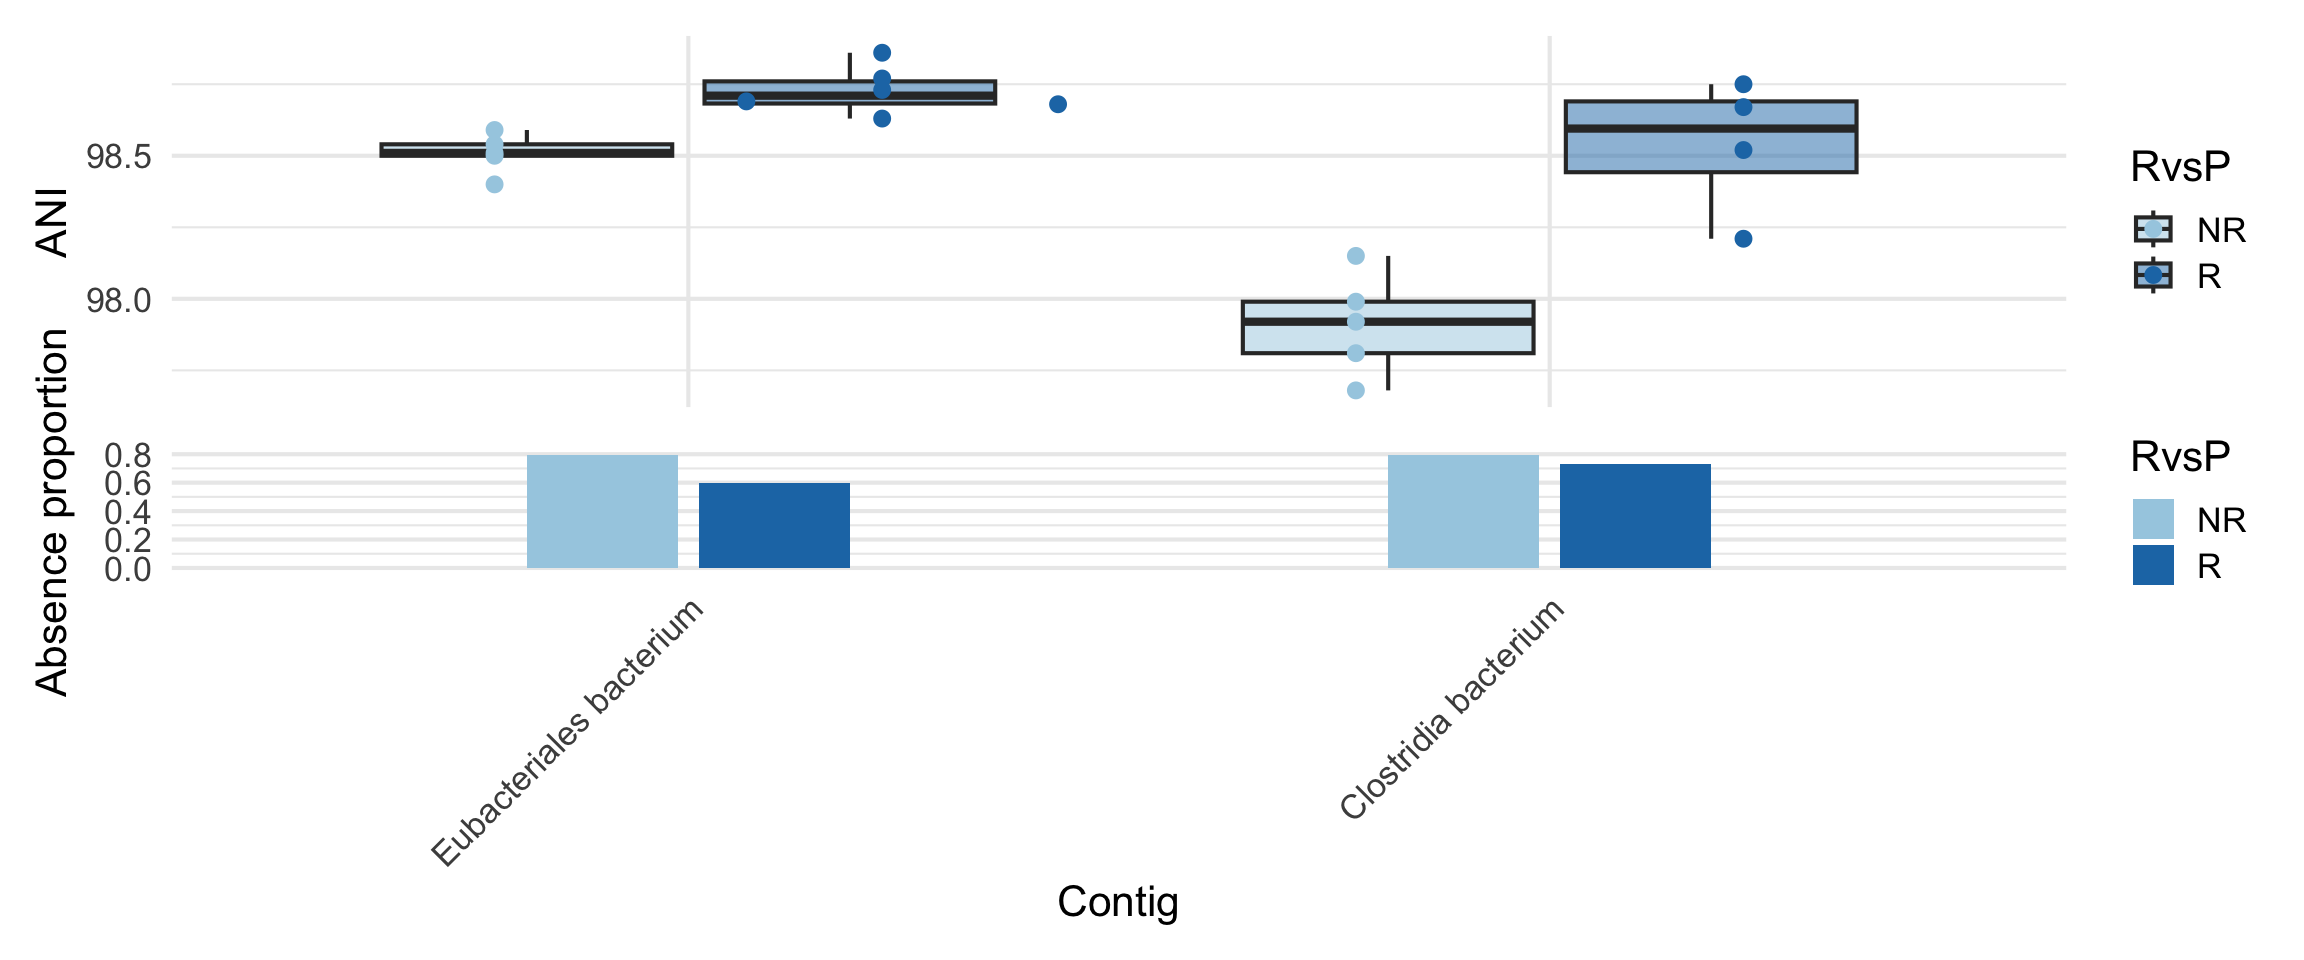
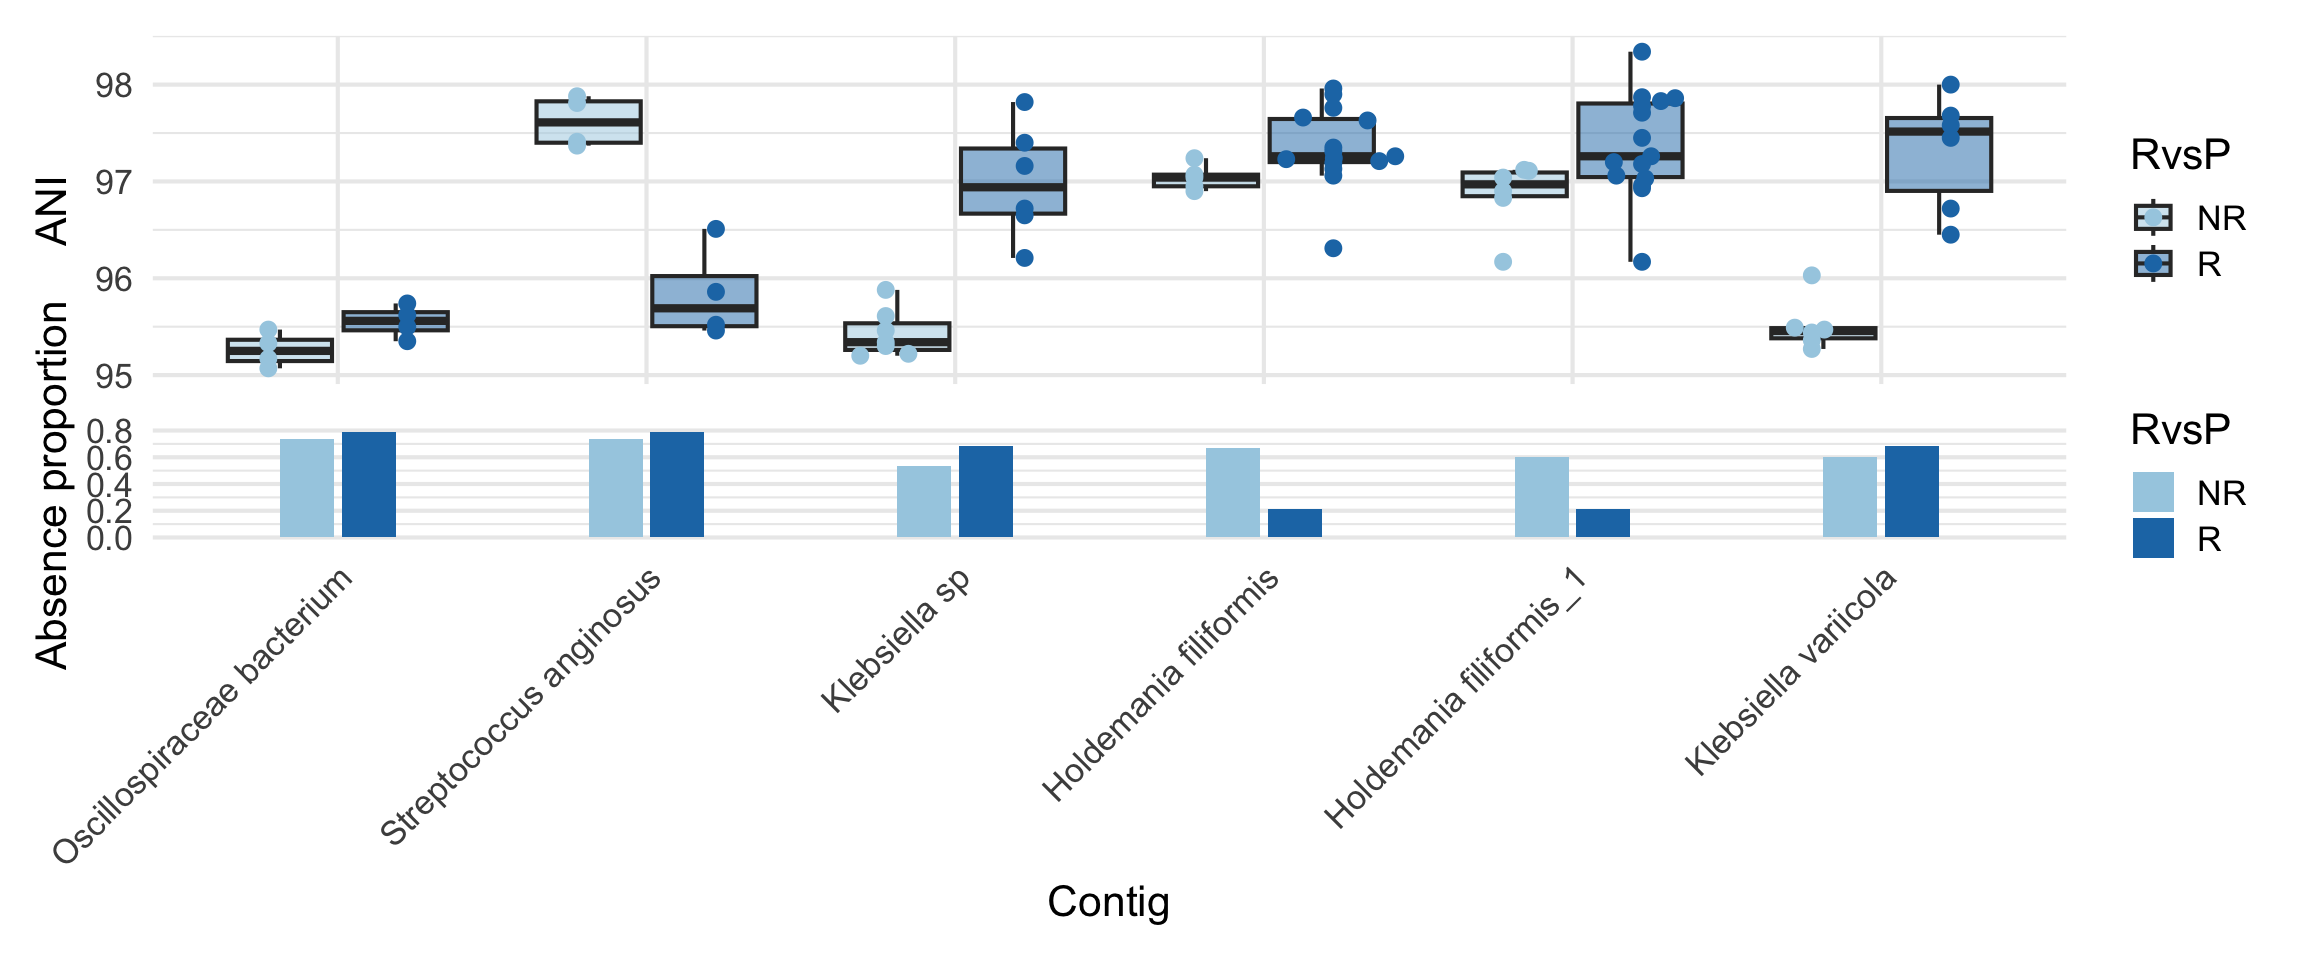
Looks like there are some hits in (1) Frankel_2017 (2) Gopalakrishnan_2018 (3) Matson_2018

Visualise

Show code
plot_ani_dist(sy[,which(sy$type == "Frankel_2017")], phenotype = 'RvsP', op_th_melanoma_ind$Contig_name[op_th_melanoma_ind$dset == "Frankel_2017"])
Warning: Removed 91 rows containing non-finite outside the scale range
(`stat_boxplot()`).

Show code
plot_ani_dist(sy[,which(sy$type == "Gopalakrishnan_2018")], phenotype = 'RvsP', op_th_melanoma_ind$Contig_name[op_th_melanoma_ind$dset == "Gopalakrishnan_2018"])
Warning: Removed 35 rows containing non-finite outside the scale range
(`stat_boxplot()`).

Show code
plot_ani_dist(sy[,which(sy$type == "Matson_2018")], phenotype = 'RvsP', op_th_melanoma_ind$Contig_name[op_th_melanoma_ind$dset == "Matson_2018"])
Warning: Removed 58 rows containing non-finite outside the scale range
(`stat_boxplot()`).

They look a bit different. Retest with therapy type as a covariate

Show code
op_th_melanoma_ind_tt = data.frame()
sets = c("Frankel_2017","Gopalakrishnan_2018","Lee_2022","Matson_2018","McCulloch_2022","Spencer_2021")
design <- as.formula("~ RvsP + therapy_type") 
for (set in sets){
  sy1 = sy[,which(sy$type == set)]
  dim(sy1)
  sy1 = filter_by_presence(sy1, ceiling(dim(sy1)[2]/10))
  
  ttbl = table(sy1$therapy_type)
  
  if(min(c( ttbl[['CICB']], ttbl[['PD1']]))  > 0.1*dim(sy1)[2]){ # 10% minimum rule
    save_path <- file.path("output_rds", paste("melanoma_tt_", set, ".rds", sep = ""))
    # design <- as.formula("~ RvsP") # no hits
    if(file.exists(save_path)){
      ZB_fit <- readRDS(save_path)
    } else {
      # Run with weak prior for prediction
      ebp = compute_eb_priors(sy1, design, nthreads = 10L, low_cutoff = 0, high_cutoff = Inf)
      ZB_fit <- glmZiBFit(sy1, design, nthreads = parallel::detectCores(), MAP_prior = ebp)
      saveRDS(ZB_fit, save_path)
    }
    th_out = top_hits(ZB_fit)
    if(nrow(th_out) > 0)
    {
      th_out = comp_ani_diff_and_posthoc_test(sy1, ZB_fit, th_out, progress = FALSE) # drop poorly supported ones on the fly
      op_th_melanoma_ind_tt = rbind(op_th_melanoma_ind_tt, 
                                    cbind(th_out, dset = set)
      )
    }
  } else {
    cat("Not enough samples for the two therapy types")
  }
  
}
Retained 18865 rows after filtering
Found 69 tophits for RvsPR at alpha = 0.05 using holm 
Retained 15631 rows after filtering
Not enough samples for the two therapy typesRetained 19319 rows after filtering
Warning in top_hits(ZB_fit): Multiple testing correction using `holm`: No
significant associations detected for coef = 2 at alpha = 0.050000
Retained 17963 rows after filtering
Not enough samples for the two therapy typesRetained 18582 rows after filtering
Not enough samples for the two therapy typesRetained 16037 rows after filtering
Not enough samples for the two therapy types
Show code
op_th_melanoma_ind_tt = op_th_melanoma_ind_tt[is.na(op_th_melanoma_ind_tt$Comment), ]

op_th_melanoma_ind_tt = strainspy:::add_tax2tophits(op_th_melanoma_ind_tt, taxonomy = tax_99, c("Genus", "Species"))

# Only hits in Frankel
plot_ani_dist(sy[,which(sy$type == "Frankel_2017")], phenotype = 'RvsP', op_th_melanoma_ind_tt$Contig_name[op_th_melanoma_ind_tt$dset == "Frankel_2017"])
Warning: Removed 122 rows containing non-finite outside the scale range
(`stat_boxplot()`).

Summary plots

Show code
summary_tbl_mel <- op_th_melanoma_ind %>%
  filter(!is.na(Species)) %>%
  group_by(Species) %>%
  summarise(
    N_hits = n(),
    
    Top_adj_p_beta  = min(p_adjust, na.rm = TRUE),
    Top_coef_beta   = coefficient[which.min(p_adjust)],
    Top_se_beta     = std_error[which.min(p_adjust)],
    Top_contig_beta = Contig_name[which.min(p_adjust)],
    
    Top_adj_p_ZI    = min(zi_p_adjust, na.rm = TRUE),
    Top_coef_ZI     = zi_coefficient[which.min(zi_p_adjust)],
    Top_se_ZI       = zi_std_error[which.min(zi_p_adjust)],
    Top_contig_ZI   = Contig_name[which.min(zi_p_adjust)],
    
    
    .groups = "drop"
  ) %>%
  mutate(
    Min_adj_p = pmin(Top_adj_p_beta, Top_adj_p_ZI, na.rm = TRUE),
    Dominant_component = ifelse(Top_adj_p_beta < Top_adj_p_ZI, "Beta", "ZI"),
    Dominant_contig    = ifelse(Dominant_component == "Beta", Top_contig_beta, Top_contig_ZI),
    Dominant_coef      = ifelse(Dominant_component == "Beta", Top_coef_beta, Top_coef_ZI),
    Dominant_se        = ifelse(Dominant_component == "Beta", Top_se_beta, Top_se_ZI)
  ) %>%
  select(Species, N_hits, Dominant_component, Min_adj_p, Dominant_coef, Dominant_se, Dominant_contig) %>%
  arrange(Min_adj_p)

beta_summary_mel <- summary_tbl_mel %>%
  filter(Dominant_component == "Beta") %>%
  arrange(Min_adj_p) %>%
  mutate(
    CI_low = Dominant_coef - 1.96 * Dominant_se,
    CI_high = Dominant_coef + 1.96 * Dominant_se,
    Trend = ifelse(Dominant_coef > 0, "\u2191 R (similar)", "\u2193 R (divergent)"),
    Species = factor(Species, levels = rev(unique(Species)))
  ) %>%
  arrange(desc(Dominant_coef)) %>%
  mutate(Species = factor(Species, levels = rev(unique(Species))))

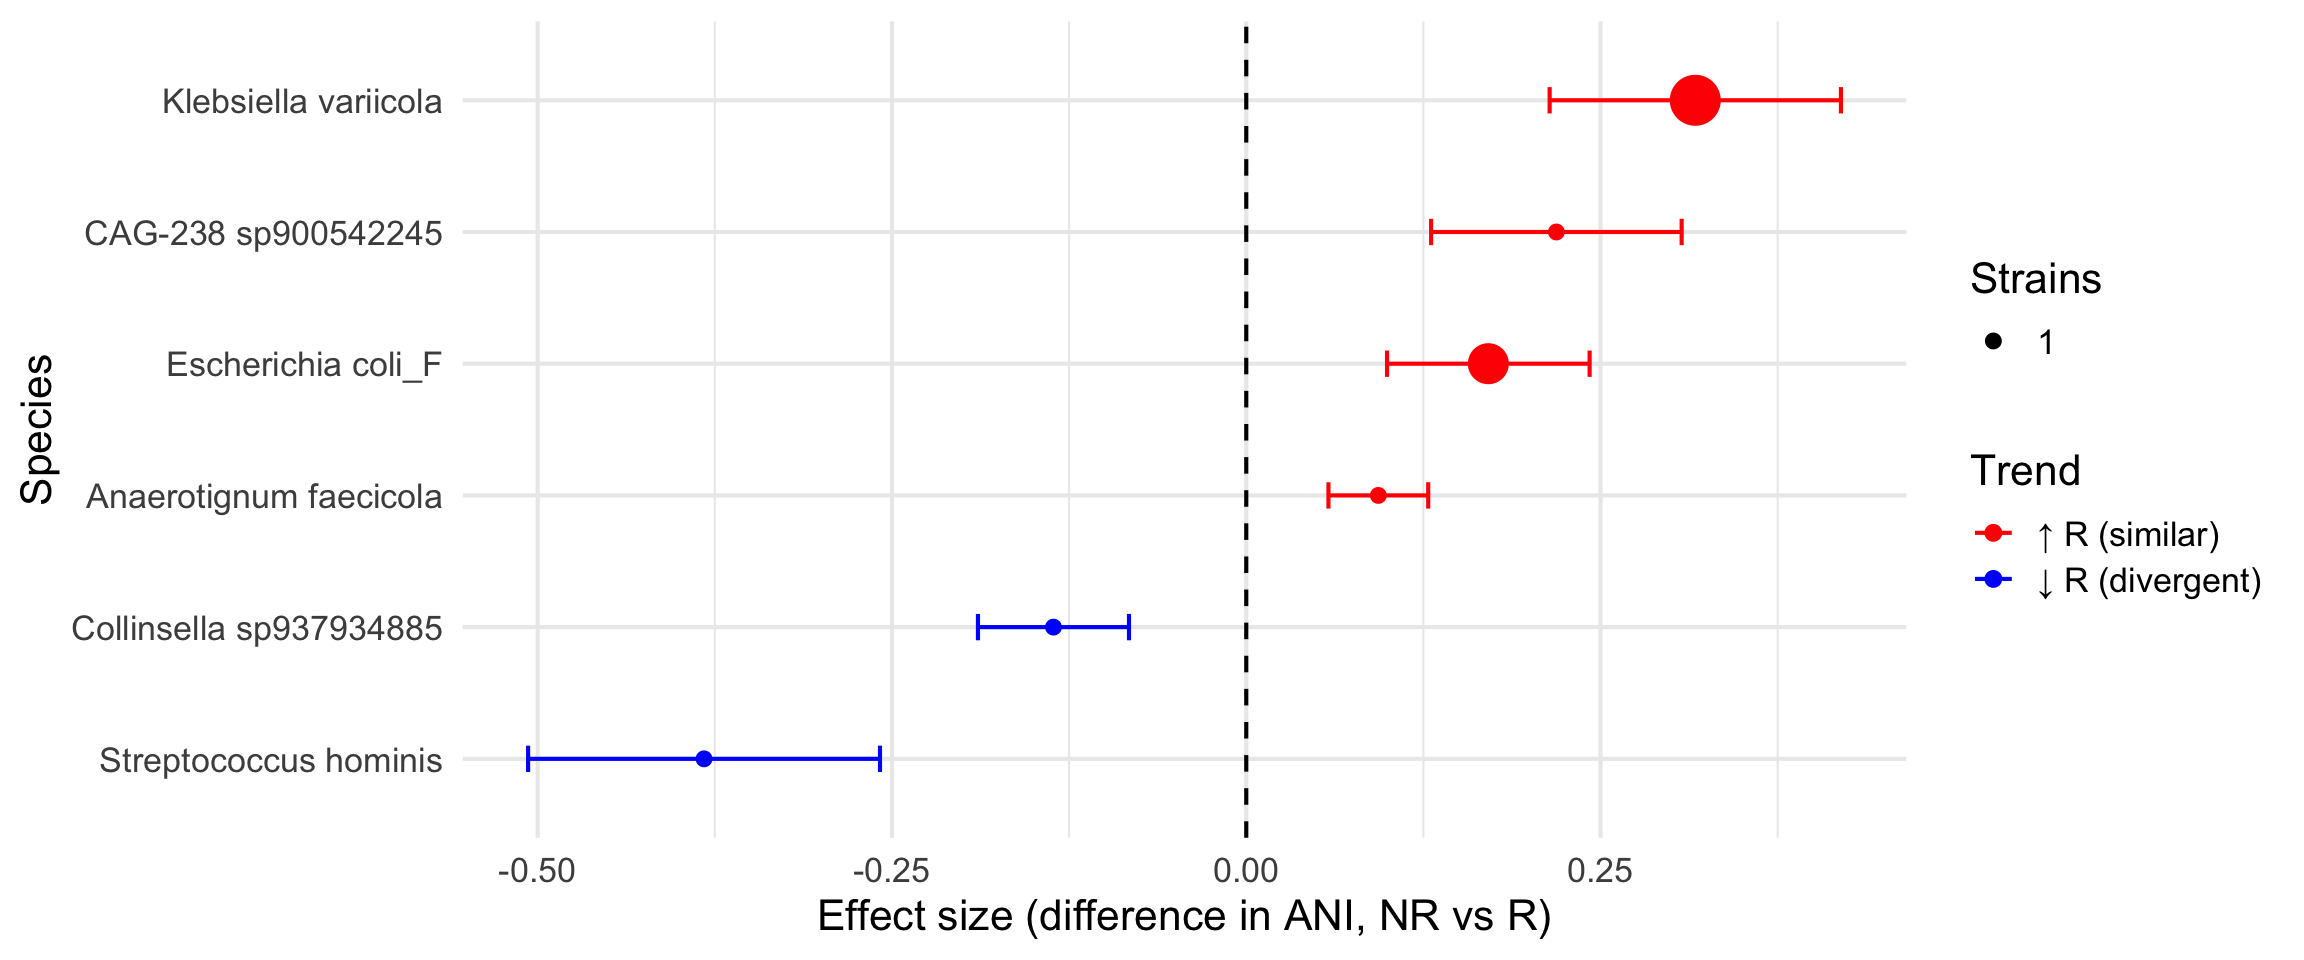
ggplot(beta_summary_mel, aes(x = Dominant_coef, y = Species, color = Trend)) +
  geom_point(aes(size = N_hits)) +
  geom_errorbarh(aes(xmin = CI_low, xmax = CI_high), width = 0.2) +
  geom_vline(xintercept = 0, linetype = "dashed") +
  scale_color_manual(values = c("\u2191 R (similar)" = "red",
                                "\u2193 R (divergent)" = "blue")) +
  scale_size_continuous(
    name = "Strains",
    range = c(2, 8),
    breaks = c(1, 5, 20),
    labels = c("1", "5", "20")
  ) +
  labs(
    x = "Effect size (difference in ANI, NR vs R)",
    y = "Species",
    color = "Trend"
  ) +
  theme_minimal(base_size = 16)
Warning: `geom_errorbarh()` was deprecated in ggplot2 4.0.0.
ℹ Please use the `orientation` argument of `geom_errorbar()` instead.